The "multi-dimensional analysis system for online fault diagnosis of cranes" recently developed by Weite has attracted the interest of many users once it was released. Recently, all kinds of inquiries and questions have poured in, especially on how to diagnose and whether the diagnosis conclusions are useful.
Today, I will show you how to diagnose the fault of the reducer and whether the diagnosis conclusion is accurate and effective.
Application of micro and special fault diagnosis and analysis system to reducer fault
Diagnostic process and verification (Episode 1)
The following is a video illustration:
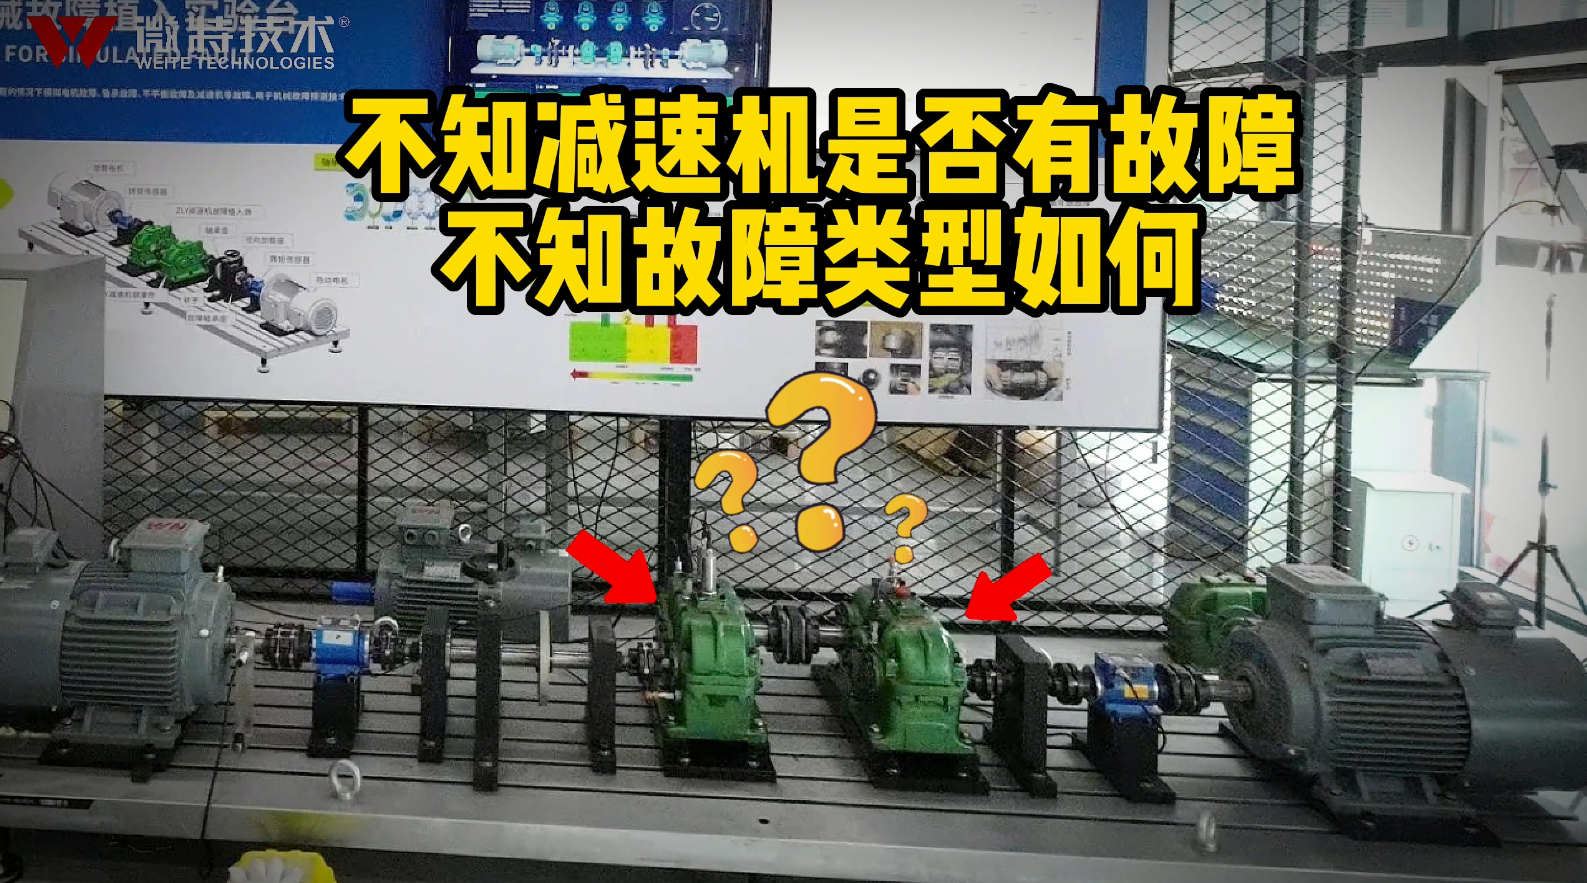
Today, let's diagnose the two reducers on the test bench. At present, we don't know whether the two reducers have faults or what the fault types are. We will diagnose and analyze the reducers through the diagnosis system, and then dismantle the reducers to verify the correctness of the conclusions.
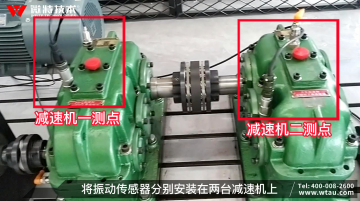
Start the rotating equipment of the test bench and install the vibration sensor on the two reducers respectively

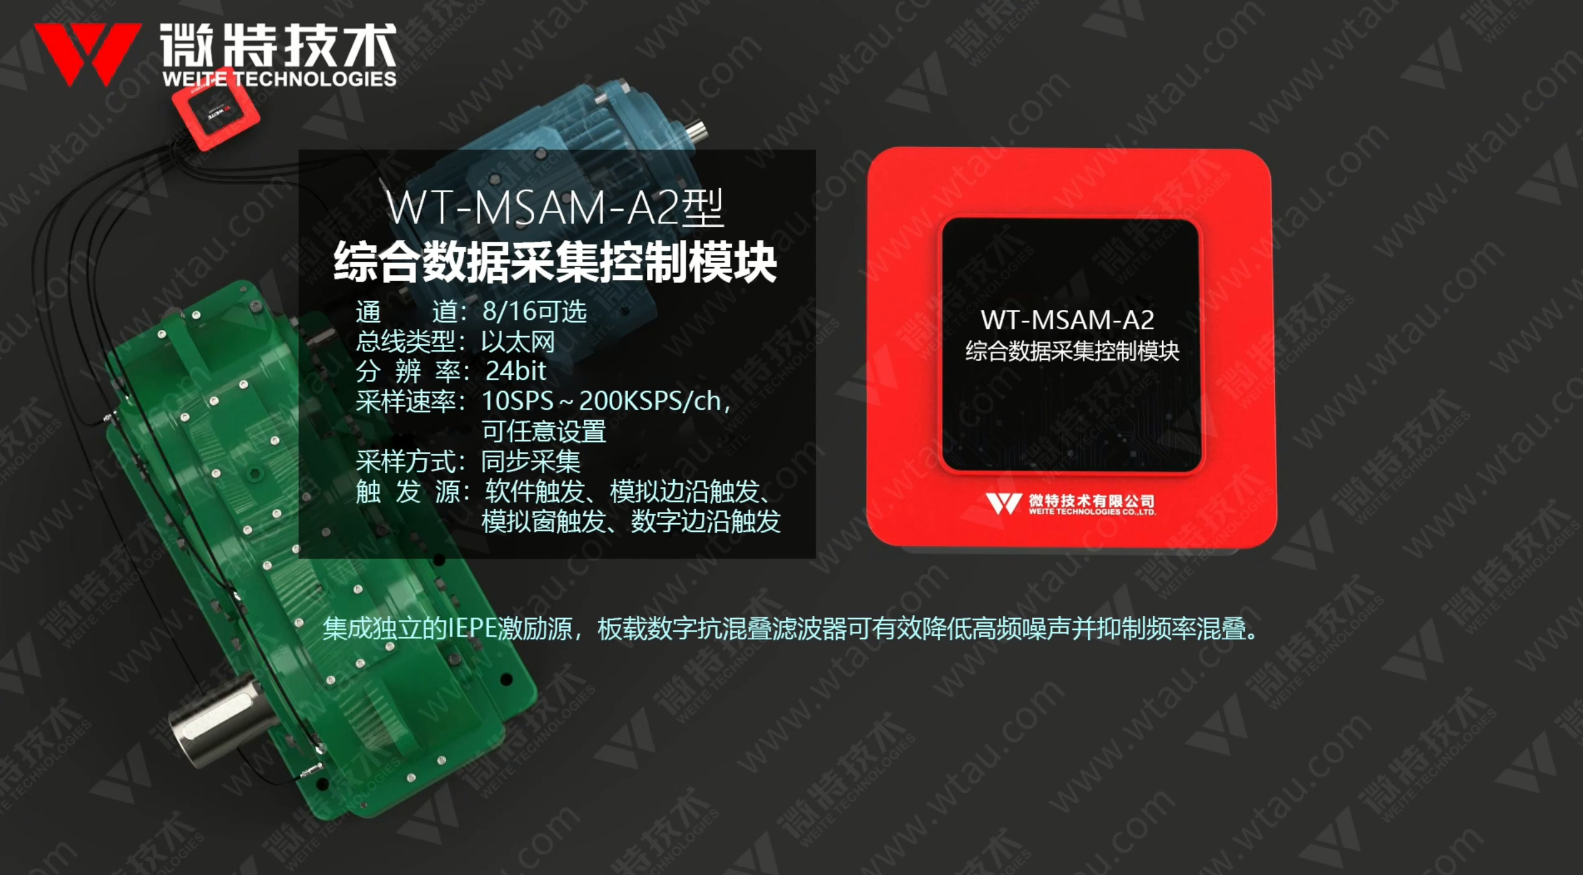
Through the wt-msam integrated data acquisition and control module, the vibration data of multiple channels are collected in real time. Through the spectrum picture, it can be seen that the vibration frequencies of the two reducers are significantly different. The analysis can be started in about 10 minutes after data collection.
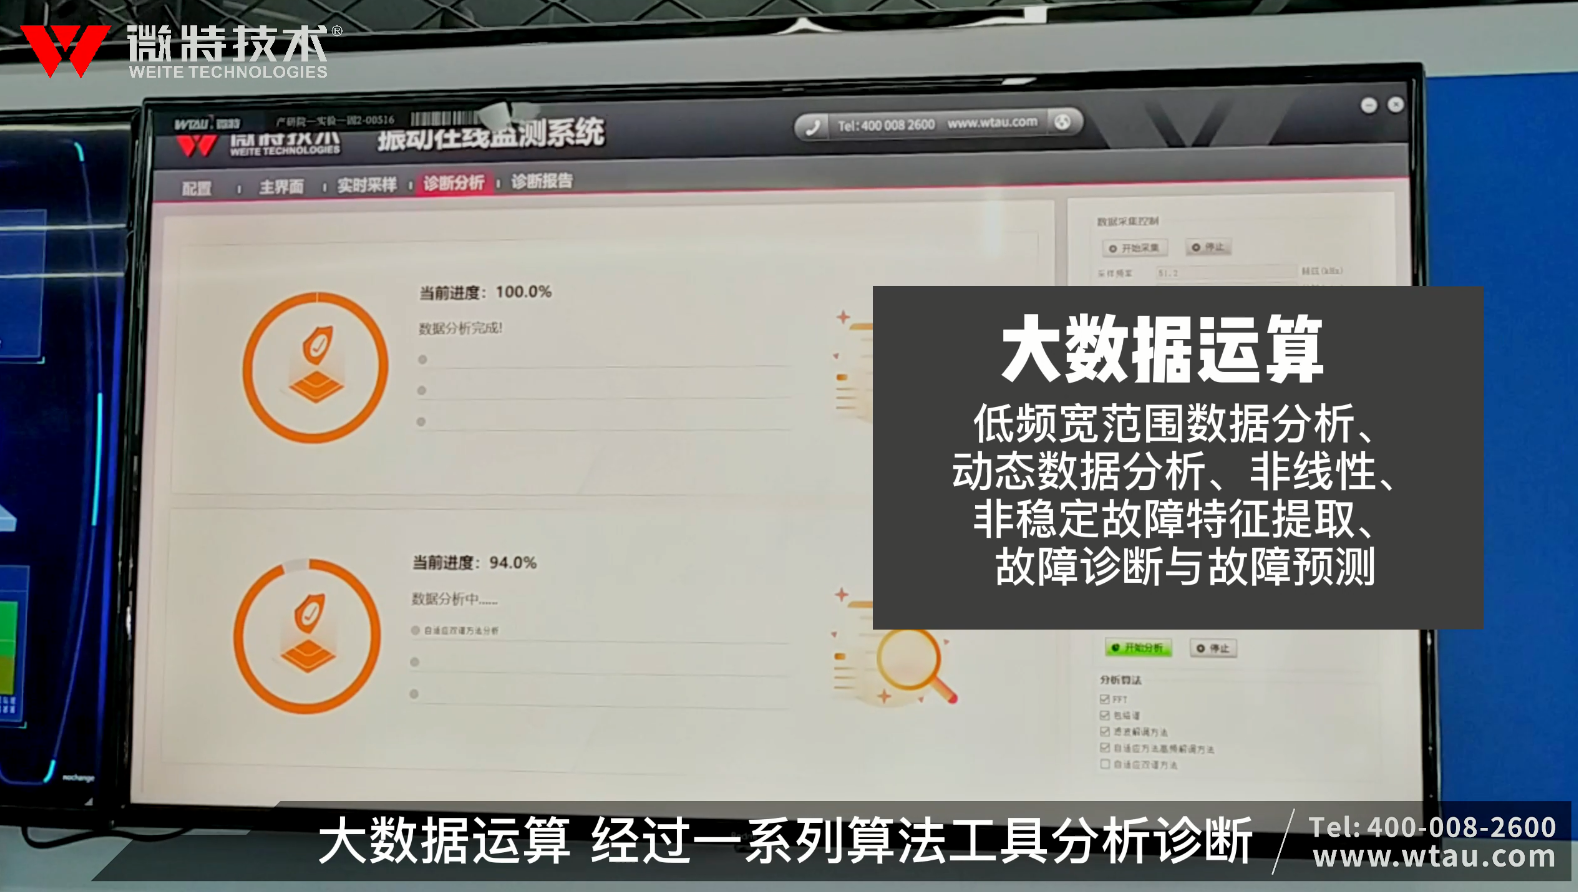
Enter the diagnostic analysis interface, and the system starts big data operation.
Microtech has developed a series of algorithm toolsets for complex fault synthesis spectrum, integrating multiple time-frequency analysis methods to realize low-frequency and wide-range data analysis, dynamic data analysis, nonlinear and unstable fault feature extraction, fault diagnosis and fault prediction.
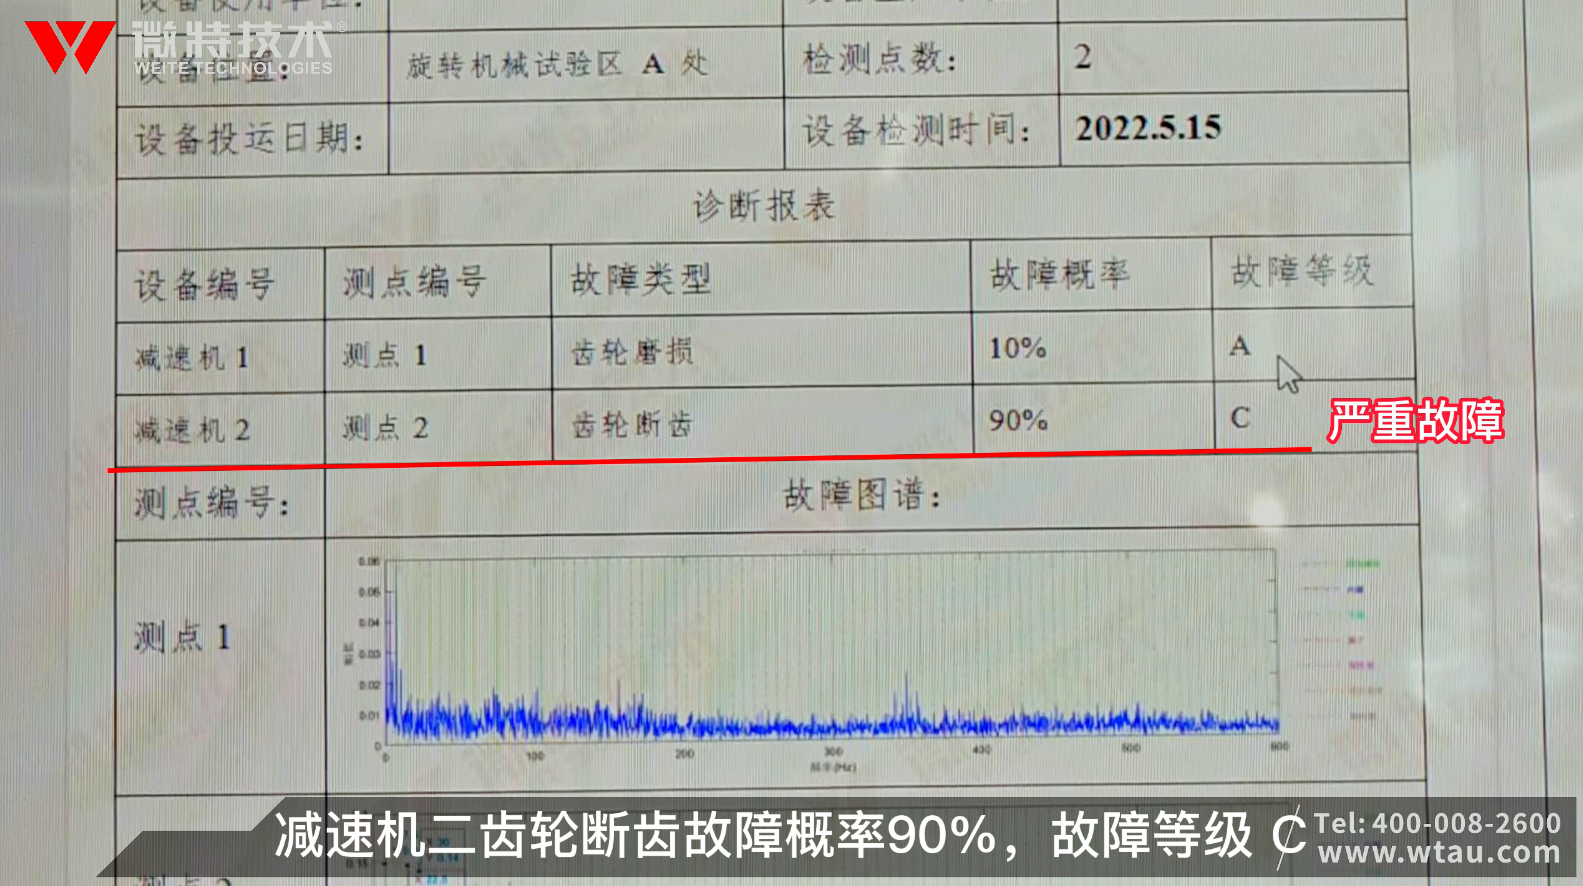
When the calculation progress reaches 100%, the diagnosis report is automatically generated. We can see that the wear probability of the first gear of the reducer is 10% and the fault level is a in the diagnosis report. The fault probability of the second gear of the reducer is 90%, and the fault level is C.
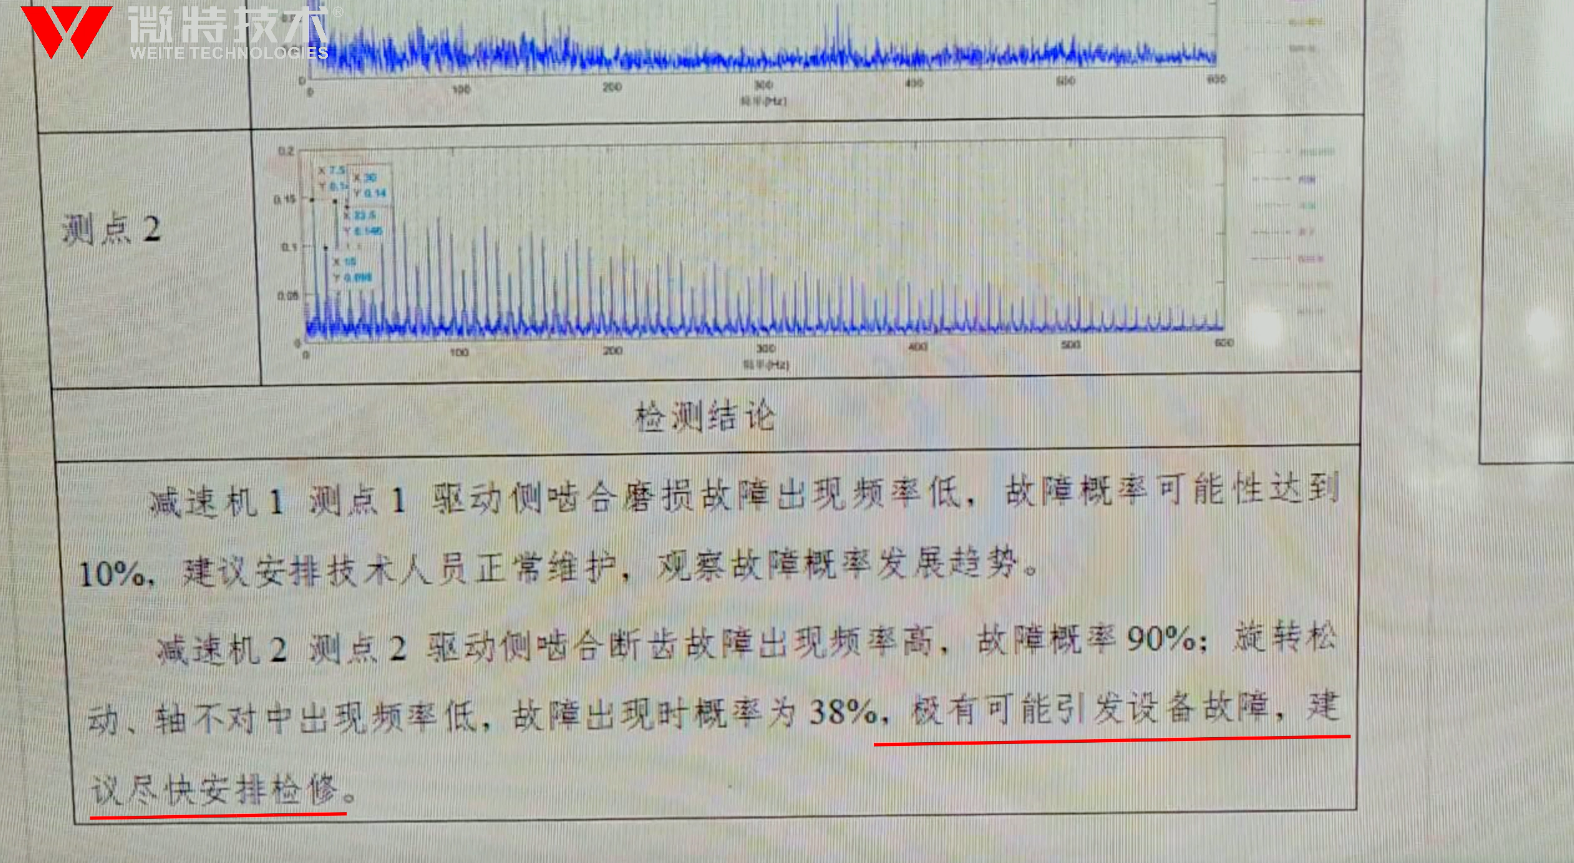
In the "detection conclusion" column, the fault descriptions of the reducers at different measuring points are given and the implementation suggestions are given. In the analysis conclusion, it is clearly recommended to arrange maintenance for the reducer 2 as soon as possible.
At this point, the process of fault diagnosis of a reducer is completed.
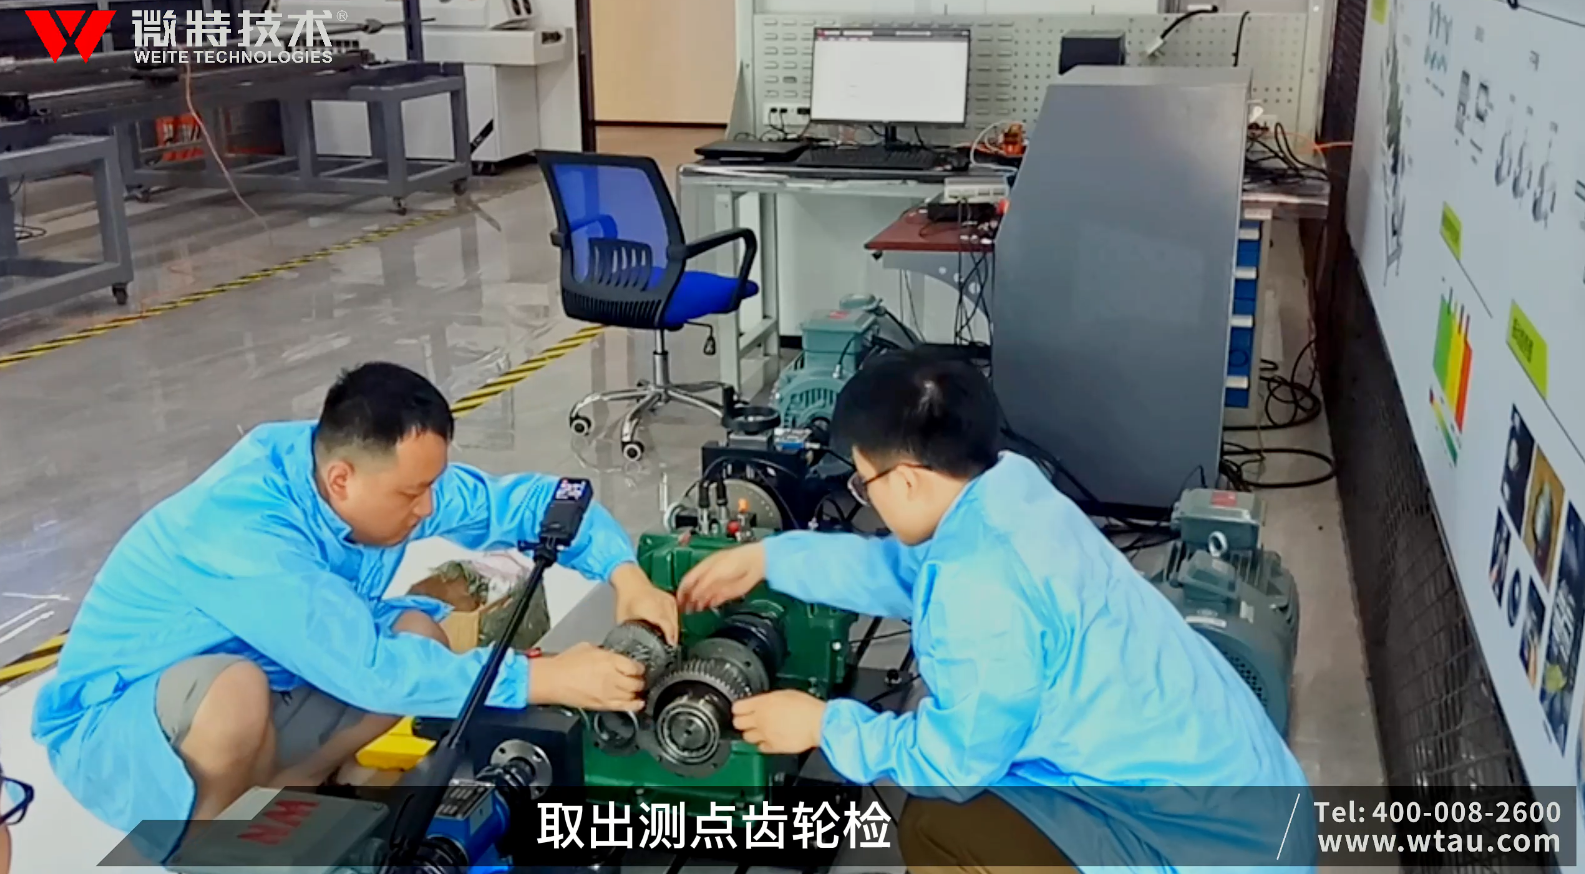
Next, keep the diagnosis result, start disassembling the reducer II, check the gear of the reducer, and verify whether the diagnosis conclusion is correct.
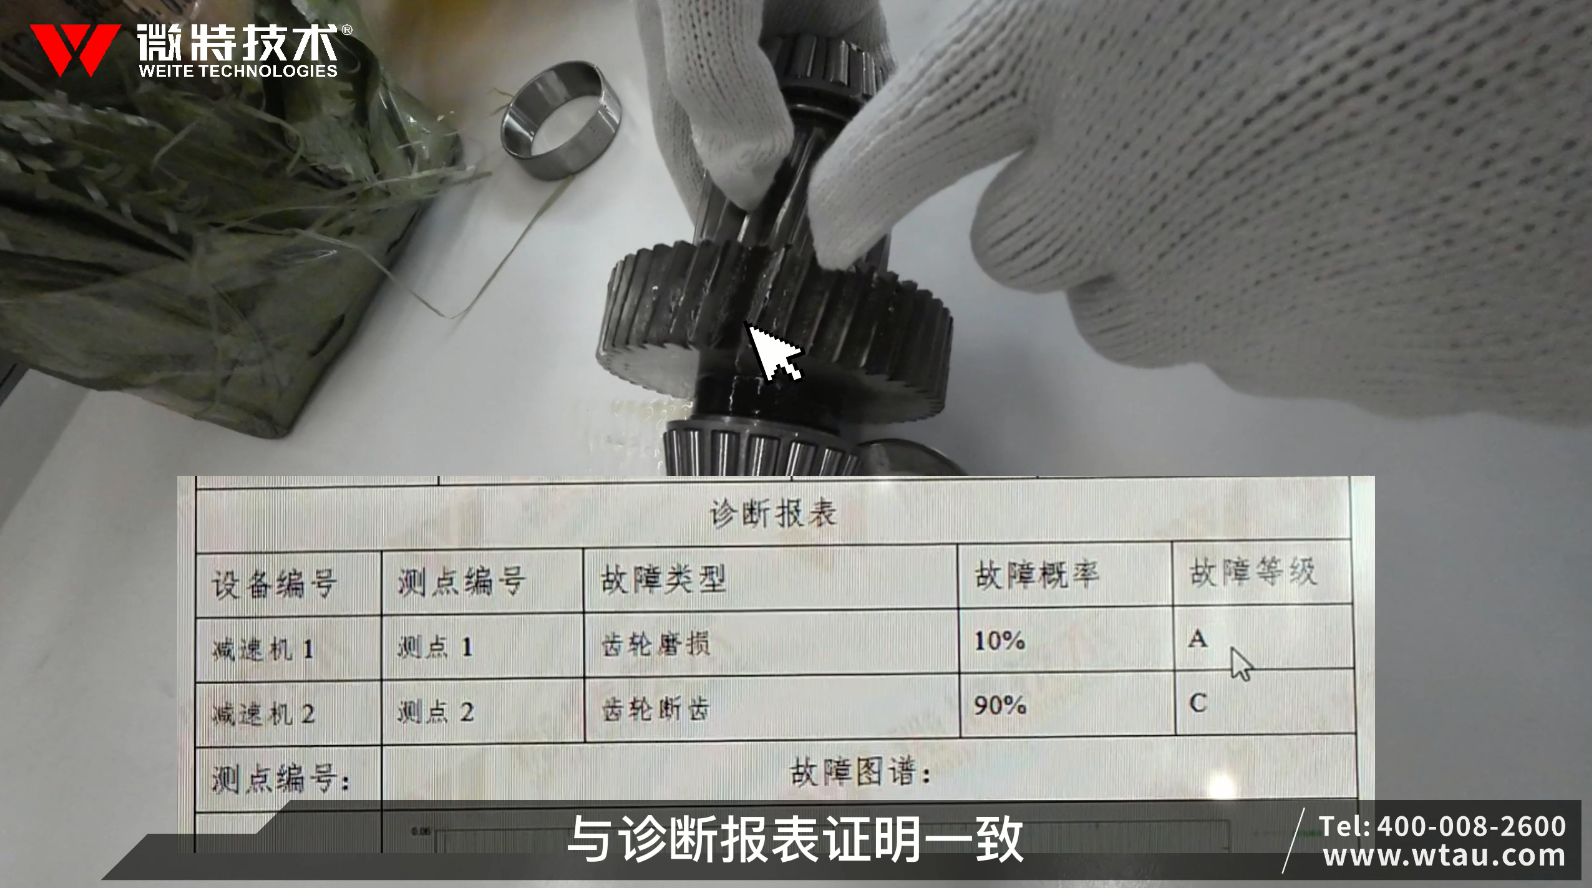
Open the upper cover of the reducer and take out the gear for inspection. It is found that there is a broken tooth on the gear. The disassembly inspection proves that the conclusion of the diagnosis report is correct, and the reducer fault is accurately and effectively analyzed.
This video answers and verifies the questions about how to diagnose the fault of the reducer and whether the diagnosis conclusion is accurate and effective. I hope it is useful to you!
Next, there will be more videos of different types of equipment fault diagnosis verification process. Please look forward to it!